

If you listen to governors talk long enough, you’d think every state has “the strongest economy in the country.”
Yesterday in State Scoreboard August, we looked at where states really rank on education. Today we’re asking a different question: which states actually have the healthiest, most dynamic economies when you look at the data side-by-side, and which ones are struggling?
This isn’t about stock tickers or vibes. It’s about a 50-state scoreboard built from public data on growth, jobs, innovation, and overall economic health.
How this economy scoreboard works
For this ranking, I’m using WalletHub’s 2026 Best & Worst State Economies study as the backbone. It’s a composite index that compares all 50 states across 28 indicators in three big dimensions:
Economic Activity — things like GDP growth, startup activity, exports, and business formation.
Economic Health — unemployment, underemployment, foreclosures, state finances.w
Innovation Potential — STEM jobs, patents, productivity, and similar measures.
WalletHub rolls those into a total score and ranks the states, with rank 1 = strongest economy. For State Scoreboard August, I’m using the 50-state comparison only.
A couple of important caveats:
This measures strength and momentum, not sheer size. A smaller state with high growth and innovation can outrank a big state with lots of raw output but weaker momentum.
Like the education index, this is a composite. Different weightings could shift some states a little, but the broad pattern is clear.
The Top 10 strongest state economies
Here are the 10 states WalletHub ranks highest on overall economic performance in 2026:
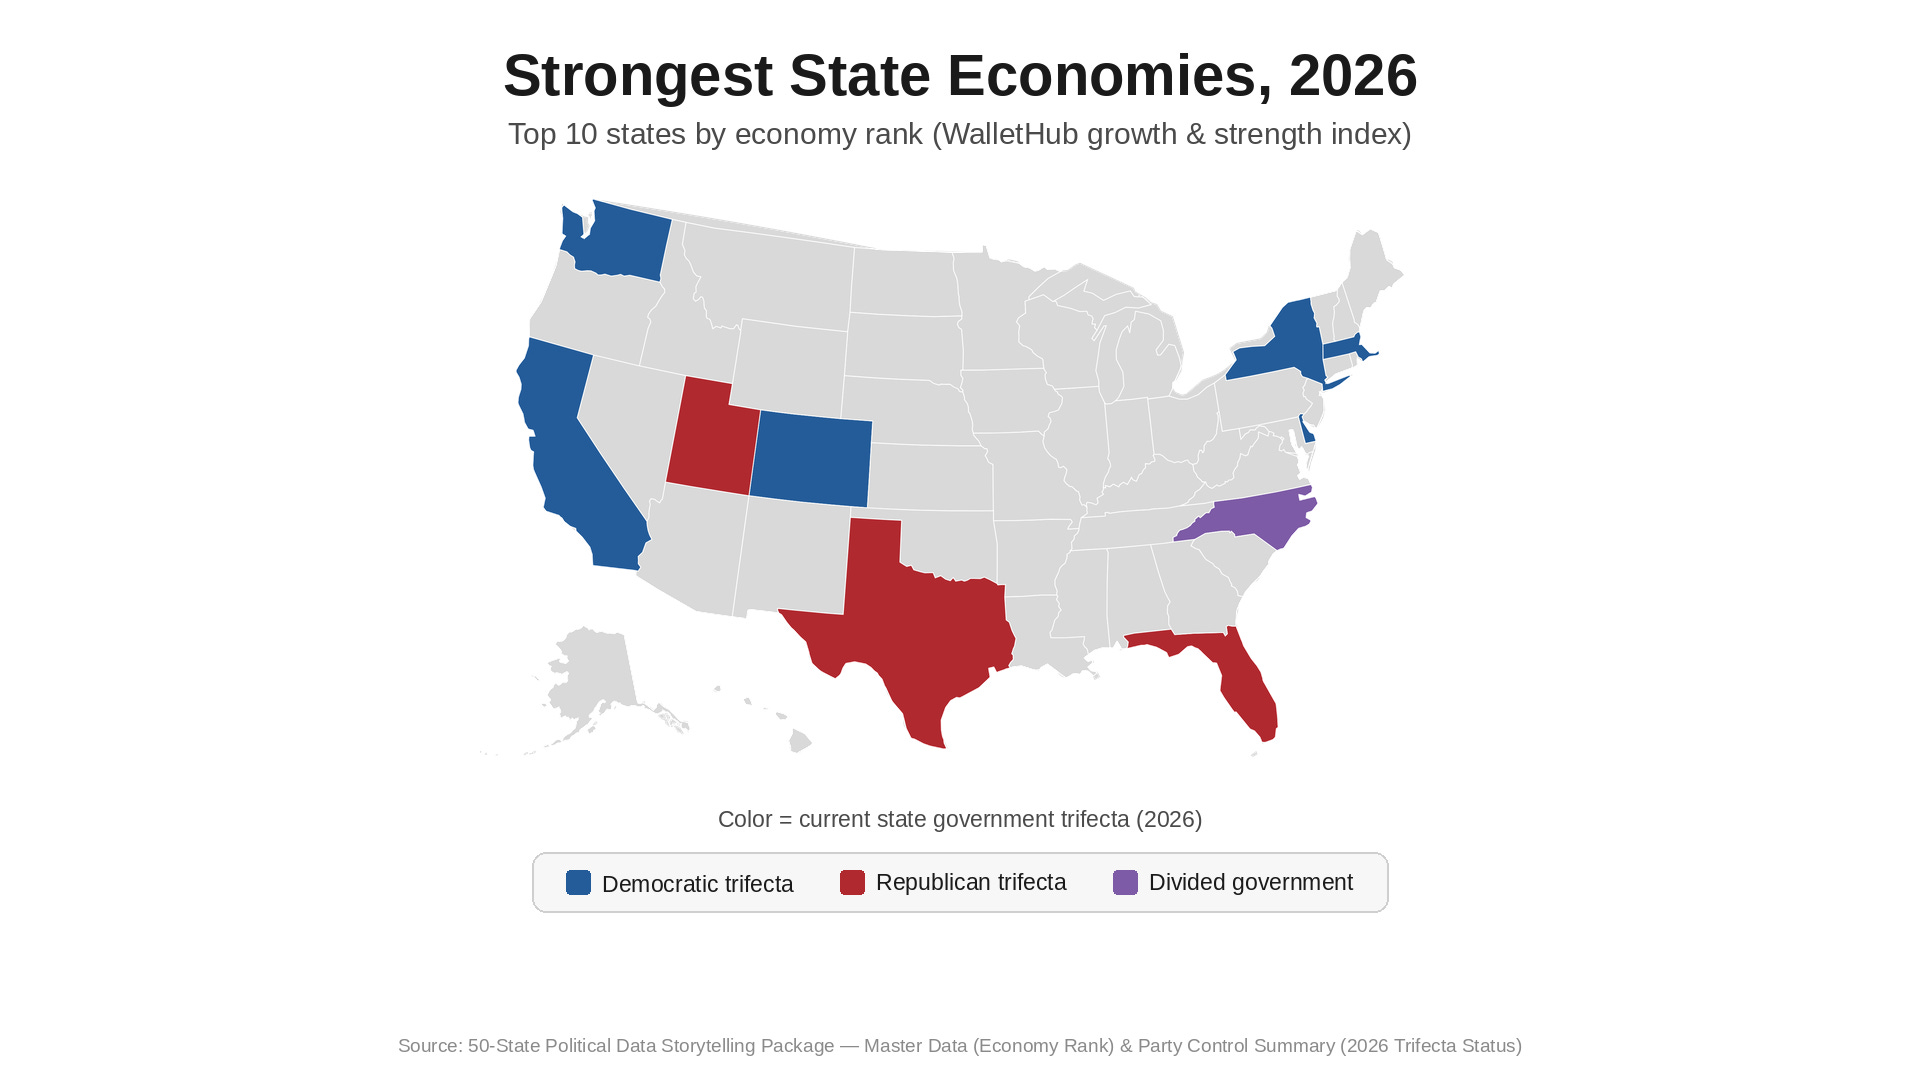
There are a few patterns here:
You see a lot of states with strong tech, finance, and innovation sectors: Washington, Massachusetts, California, New York.
You also see fast-growing Sun Belt states like Utah, Texas, Florida, North Carolina, and Arizona.
Some of these top economic performers- Massachusetts, Washington, and Colorado- also showed up near the top of the education scoreboard yesterday, which is not a coincidence.wallethub+1
In the map graphic for this episode, these Top 10 states are highlighted and colored by today’s state-government trifecta: blue for Democratic control, red for Republican, purple/gray for divided government. That matters later in the month when we talk about how long one party has been at the wheel in each state.
The Bottom 10 weakest state economies
Now let’s look at the other end of the list, the states WalletHub ranks as having the weakest overall economies.
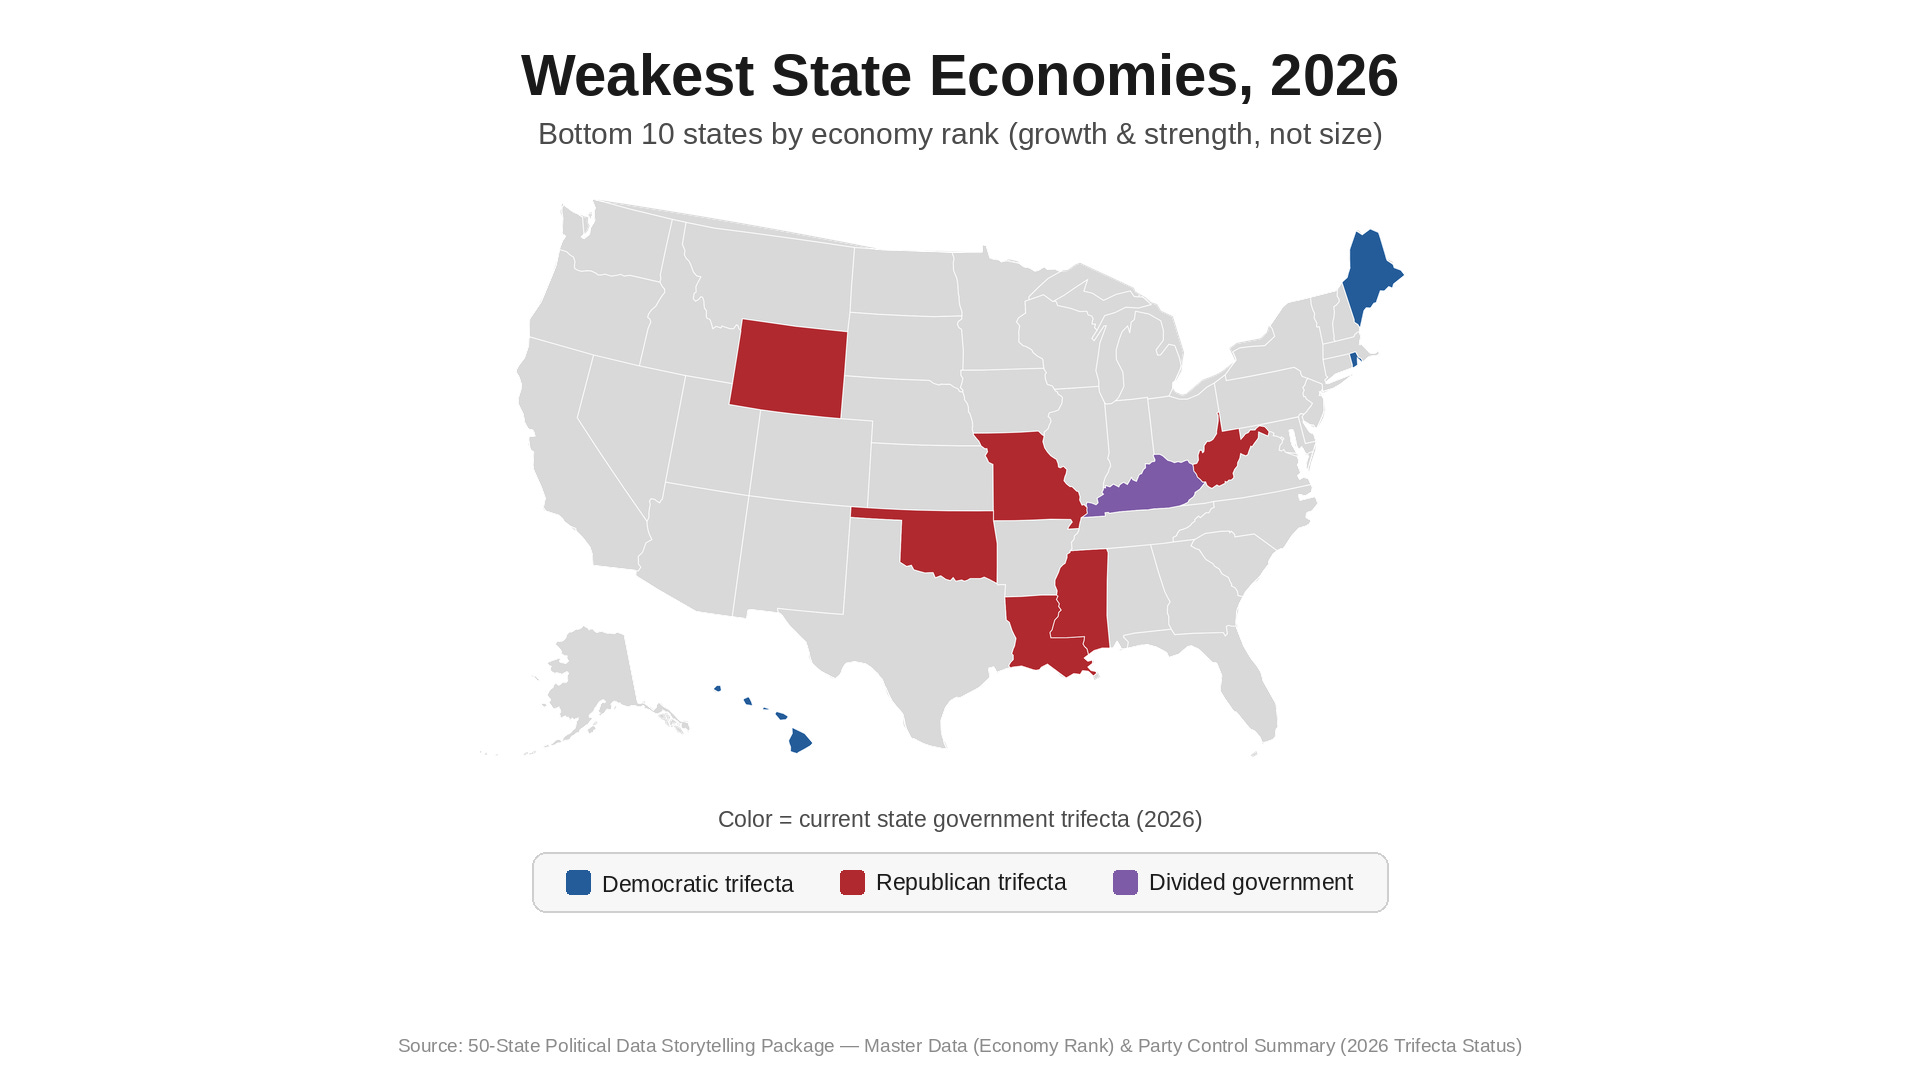
Again, the pattern overlaps with what we saw on education:
West Virginia, Kentucky, Louisiana, Mississippi already showed up near the bottom of the education rankings.
Several of these states depend heavily on a narrow set of industries, which makes them more vulnerable when those sectors slow down.
On the map, those Bottom 10 states are highlighted and colored by who currently controls state government. Over the course of State Scoreboard August, we’re going to keep asking: when a state has both a weak education ranking and a weak economy, who has been running that state, and for how long?
What this tells us, and what it doesn’t
A couple of things I want to underline:
Being at the top of this economic list doesn’t mean everyone in that state is thriving. You can have a booming state economy and still have deep inequality or high housing costs. These rankings are about macro-performance, not justice.
Being at the bottom doesn’t mean people in those states aren’t working hard. Usually it means the opposite: people are working hard in systems that have not been built to reward their effort.
What the map does show, once you lay it next to the education map from Day 1, is a strong relationship between human capital and economic strength. States that invest in education over the long term tend to show up higher on economic strength; states that underinvest tend to struggle on both fronts.
That’s not destiny. Policy choices and power structures matter. Which is why the next part of this series starts to bring in party control and long-term governance.
Where we’re going next
Our next State Scoreboard August entry will look at healthcare performance by state: who has built a functional health system, who hasn’t, and how those rankings line up with the education and economy maps you’ve already seen.
Later this month, we’ll start doing stacked views:
States that are strong on both education and economy.
States that are weak on both, especially in the Deep South and Appalachia.
How those patterns line up with 20 years of party control and with federal money flows, who’s a net contributor to Washington and who’s a net recipient.
The goal is the same as Day 1: not to dunk on any one state, but to tell the truth about systems and power so you can walk into the midterms with a clearer picture of how your state is really doing.
Your turn
Where does your state land on the economy map?
Drop your state in the comments and tell me what you hear local politicians say about “jobs” and “growth.” In a future episode, I’ll pull those claims up against this scoreboard: education, economy, and healthcare together, and ask what the numbers actually show.
State Scoreboard August is about being ranked, not ranted. Every number has a source. And the story of your state’s economy is bigger than any campaign speech.


